Equal Highs/Lows Multi-Pivot [Julio]Equal Highs/Lows Multi-Pivot
Description
A sophisticated multi-timeframe pivot analysis tool that detects and highlights equal highs and equal lows across four different pivot lengths simultaneously. This indicator identifies price levels where the market creates identical extremes, a powerful signal of institutional support/resistance and potential reversal or breakout zones.
How It Works
Four Independent Pivot Streams
Pivot 1 (Intraday - 2 bars): Ultra-fast level detection for scalpers
Pivot 2 (Session - 4 bars): Short-term swing levels
Pivot 3 (Daily - 6 bars): Medium-term structural levels
Pivot 4 (Weekly - 9 bars): Long-term institutional levels
Equal High (EQH) Detection
Compares consecutive swing highs and draws a line when two highs are nearly identical within a defined threshold. The indicator uses ATR-based confluence to determine "equality," filtering out noise while catching true market structure.
Equal Low (EQL) Detection
Same logic applied to swing lows, identifying support zones where price repeatedly fails to break below previous lows.
Key Features
Four Simultaneous Timeframes: Analyze intraday, session, daily, and weekly structures all on one chart
ATR-Based Confluence Threshold: Automatically adjusts sensitivity based on current volatility (no fake signals)
Color-Coded Levels: Each pivot length has distinct colors for instant visual identification
Highs: Red, Orange, Yellow, Fuchsia
Lows: Green, Blue, Aqua, Purple
Confirmation Mode: Optional setting to wait for full pivot confirmation before marking levels
Customizable Alert Zones: Toggle individual pivot lengths on/off to reduce clutter
Smart Label Positioning: Labels auto-center between the two equal pivots for clarity
Ideal For
Swing traders tracking support/resistance across multiple timeframes
Scalpers identifying micro-structure for quick entries and exits
Market structure analysts studying institutional price action patterns
Multi-timeframe traders needing confluence from intraday to weekly levels
Anyone trading 1-minute to 4-hour charts
Trading Applications
Identify strong support/resistance zones: Equal levels = confirmed institutional levels
Confirm trend reversals: Multiple equal lows = strong accumulation zone; multiple equal highs = distribution
Plan entries with precision: Enter near equal levels for higher probability setups
Detect liquidity concentration: Where price repeatedly tests the same level
Multi-timeframe confluence: Look for equal levels across multiple pivot lengths for ultra-strong zones
How to Use
Identify the equal levels: Color-coded lines instantly show where price creates matching extremes
Check for confluence: Strong setups occur where multiple pivot lengths align
Wait for price action: Watch for breakouts through equal levels or reversals at these zones
Enter with structure: Use equal levels as entry/exit triggers combined with your trading methodology
Manage with confidence: These levels mark institutional decision points
Customization Options
Adjust pivot lengths to match your preferred timeframe structure
Set ATR threshold sensitivity (lower = stricter equality, higher = more signals)
Toggle confirmation mode for additional filter
Enable/disable individual pivot streams to reduce visual clutter
Customize colors to match your chart theme
Default Settings Optimized For
NASDAQ futures and liquid forex pairs
Intraday and swing trading (1-minute to 4-hour charts)
Smart Money / ICT trading methodologies
Volatility-adjusted confluence detection
חפש סקריפטים עבור "high low"

Last 10 Sessions: High, Low, Pivot, GapLast 10 Sessions: High, Low, Pivot, Gap
This indicator highlights the most important price levels from the last 10 completed trading sessions to help intraday and swing traders quickly spot potential support, resistance, and price reaction zones.
Key Features:
Previous Highs and Lows : Visualize the high and low from each of the past 10 sessions. These are the most commonly tested breakout and reversal points for day trading.
Session Pivots: The classic pivot formula ((High + Low + Close) / 3) for each of the last 10 sessions, often acting as a market “equilibrium” or intraday magnet.
Gaps: Displays the difference between each day’s open and the previous session’s close (“gap”), showing sentiment shifts and possible gap fill targets.
Clean, Faded Visuals: All lines and labels are subtly faded so your chart remains clear and uncluttered, with each level labeled by how many sessions ago it occurred.
Full Customization: Instantly toggle any level type (High, Low, Pivot, Gap) ON/OFF in settings, extend lines to the right, and adjust their forward length.
Bulletproof Logic: Never throws runtime errors. Lines and labels only display when valid data is present.
How to Use:
Use recent highs/lows for breakout, breakdown, or mean reversion trades.
Spot where multiple levels from past sessions cluster together for high-probability reversal or breakout areas.
Watch pivots for intraday bias, and gaps for sentiment and possible fill plays.
Perfect for all intraday timeframes.
If you want a powerful yet minimal map of where price is most likely to react, this indicator is for you!
Developed by

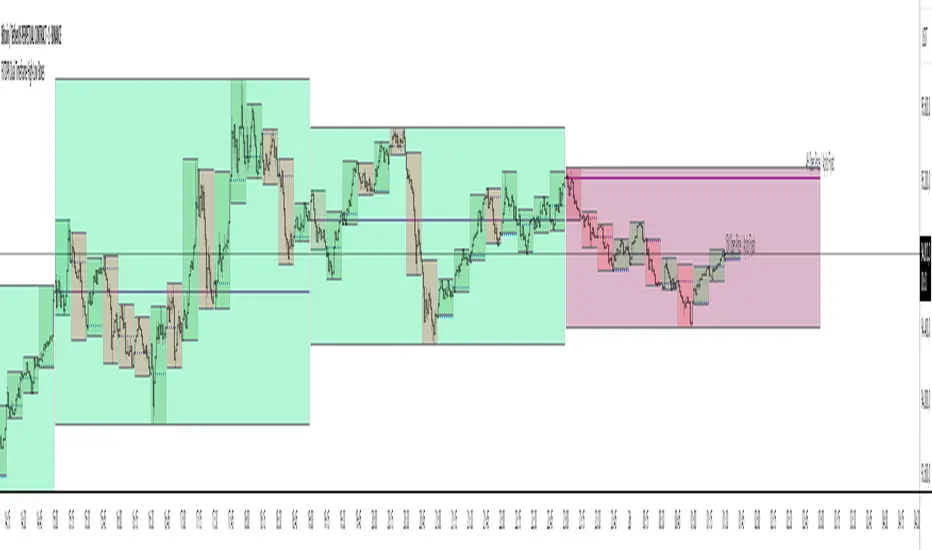
FXTDPR Dual Timeframe High-Low BoxesThe "Dual Timeframe High-Low Boxes" indicator is designed to visualize price ranges and key levels across two user-defined timeframes (default: 15-minute and 4-hour) on the same chart. It draws rectangular boxes representing the high and low price levels within each timeframe, along with a horizontal line indicating the opening price of the timeframe. Labels are added to mark the opening price with bilingual text (English/Turkish). The indicator is highly customizable, allowing users to adjust timeframes, colors, transparency, line styles, and display options.
// Key Features:
// 1. **Dual Timeframe Support**: Simultaneously displays boxes for two timeframes (e.g., 15M and 4H), enabling analysis of both short-term and long-term price movements.
// 2. **High-Low Boxes**: Each box represents the highest and lowest prices within the selected timeframe, dynamically updating as new highs or lows occur.
// 3. **Opening Price Line**: A horizontal line is drawn at the opening price of each timeframe, fixed from the start to the end of the timeframe period.
// 4. **Bilingual Labels**: Labels display the timeframe and opening price in both English and Turkish (e.g., "15M Open Price / Açılış Fiyatı") for enhanced accessibility.
// 5. **Customizable Display**: Users can choose to display boxes for both timeframes, only Timeframe 1, or only Timeframe 2 via the "Display Timeframes" setting.
// 6. **Color and Style Customization**: Separate settings for bullish/bearish box colors, opening price line color, line style (solid, dashed, dotted), and label text color for each timeframe.
// 7. **Transparency Control**: Adjustable transparency for boxes to prevent chart clutter.
// 8. **Performance Optimization**: Limits the number of displayed boxes to 500 (via max_boxes_count) to ensure smooth performance.
// 9. **Accurate Timing**: Boxes start precisely at the beginning of each timeframe’s candle (e.g., 16:45 for 15M, 00:00 for 4H), ensuring alignment with the selected timeframe.
// 10. **No Input Confirmation**: The indicator starts with default settings (15M and 4H, both displayed) without requiring user confirmation, streamlining the setup process.
// How It Works:
// - The indicator uses request.security() to fetch time data for the user-defined timeframes and detects new timeframe periods using ta.change().
// - For each timeframe, it initializes a box at the start of the period, setting the initial high, low, and open prices.
// - As new candles form within the timeframe, the box’s high and low boundaries are updated to reflect the highest and lowest prices.
// - The box color changes based on whether the closing price is above (bullish) or below (bearish) the opening price.
// - A fixed horizontal line is drawn at the opening price, spanning the timeframe’s duration, with a label at the end of the box indicating the timeframe and opening price.
// - Users can toggle between displaying both timeframes or a single timeframe, with all settings (colors, styles, transparency) applied independently for each timeframe.
// Usage:
// - Add the indicator to your chart, and it will automatically display 15M and 4H boxes with default settings.
// - Use the settings menu to customize timeframes, colors, line styles, transparency, or to select which timeframes to display.
// - Ideal for identifying support/resistance levels, breakout opportunities, or trend analysis across multiple timeframes.
// Notes:
// - For optimal performance, use a chart timeframe equal to or lower than the smaller selected timeframe (e.g., 15M chart for 15M and 4H boxes).
// - The indicator is designed for flexibility, supporting timeframes from 1 minute to monthly periods.
// - To avoid chart clutter, adjust transparency settings or reduce max_boxes_count for long historical data.
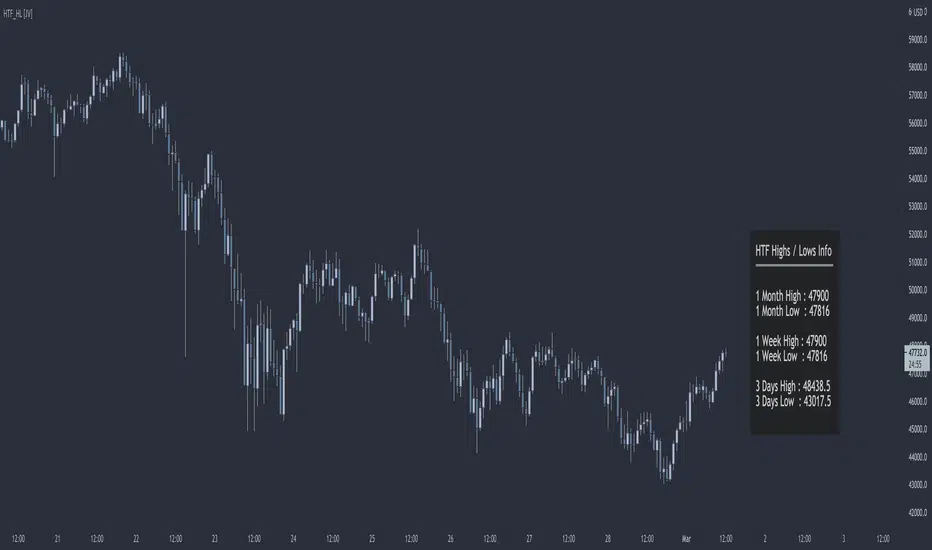
HTF Highs Lows [JV]█ OVERVIEW
This script presents a label with an overview of higher timeframe highs and lows. This can be useful information as we all know that price likes to revisit previous highs and lows area, specially on the higher timeframe.
█ CONCEPTS
This information can be relevant and valuable for various reasons:
Finding horizontal Support and Resistance
Get a better view on Market Structure
Provide some information about Order Flow
TrendLines
...
█ FEATURES
Plots
This script provides the option to show information about 3 timeframes
Each timeframe can be separately shown or hidden
The Y position of the info label can be user defined, based on high or low of the chosen timeframe
The X offset of the info label can be adjusted to the user's liking and the chart resolution
The label color and text color can be user defined
The info label's size can be user defined
█ NOTES
Caveat
The timeframes must be chosen in order of size. Meaning that the highest timeframe should be on top. This is title as such on the info label, but I want to mention it again as it's something to pay attention to.
Repainting
The question that pops up all the time is: Does it repaint ?
I will quote PineCoders on this:
We're pretty sure Wilder was not asked very often if RSI repainted. Why? Because it wasn't in fashion—and largely unnecessary—to ask that sort of question in the 80's. Many traders back then used daily charts only, and indicator values were calculated at the day's close, so everybody knew what they were getting. Additionally, indicator values were calculated by generally reputable outfits or traders themselves, so data was pretty reliable. Today, almost anybody can write a simple indicator, and the programming languages used to write them are complex enough for some coders lacking the caution, know-how or ethics of the best professional coders, to get in over their heads and produce code that does not work the way they think it does.
Briefly: yes, it repaints and no it does not matter.
Simple because we are working with highs and lows on a higher timeframe. So if we get a new high or low within a certain time frame, we want this new high or low to be displayed and, for me, it's not relevant if this information appears when it happens or when the candle closes.
Questions & Suggestions
Questions, suggestions or even a word of thanks are always welcomed in the comments section. I usually answer within the same day.
█ THANKS
A word of thanks to, and I hope I am allowed to use hyperlinks here, LonesomeTheBlue for being an inspiration on coding style and his work on arrays in Pine Script and to lmatl for his support, words of advice and letting me borrow his brain now and then.
30-Minute High and Low30-Minute High and Low Levels
This indicator plots the previous 30-minute candle’s high and low on any intraday chart.
These levels are widely used by intraday traders to identify key breakout zones, liquidity pools, micro-range boundaries, and early trend direction.
Features:
• Automatically pulls the previous 30-minute candle using higher-timeframe HTF requests
• Displays the HTF High (blue) and HTF Low (red) on lower-timeframe charts
• Works on all intraday timeframes (1m, 3m, 5m, 10m, etc.)
• Levels stay fixed until the next 30-minute bar completes
• Ideal for ORB strategies, scalping, liquidity sweeps, and reversal traps
Use Cases:
• Watch for breakouts above the 30-minute high
• Monitor for liquidity sweeps and fakeouts around the high/low
• Treat the mid-range as a magnet during consolidation
• Combine with VWAP or EMA trend structure for high-precision intraday setups
This indicator is simple, fast, and designed for traders who rely on HTF micro-structure to guide intraday execution.

Swing High-Low Line ConnectorSwing High-Low Line Connector is a simple and intuitive tool that automatically detects swing highs and swing lows using fractal-style pivot logic and connects them with clean, continuous lines. This indicator helps traders visualize market structure, trend shifts, and swing-based support/resistance levels at a glance.
The script identifies each confirmed swing point based on a user-defined lookback window (left/right bars). When a new swing is confirmed, the indicator updates the previous leg or creates a new one, effectively drawing the classic “zigzag-style” connections used in discretionary trading and price-action analysis.
A dynamic tail extension is included to show the most recent swing extending toward the current price. By default, the tail follows a ZigZag-style logic—extending upward after a swing low and downward after a swing high—but users can also anchor it to Close, High, Low, or HL2.
Features
Automatic detection of swing highs and swing lows
Clean line connections between swings (similar to discretionary market-structure mapping)
Proper consolidation handling: weaker highs/lows are ignored
Optional ZigZag-style dynamic tail extension
Fully customizable lookback window, line color, and line width
Works on any market and timeframe
Use Cases
Identifying market structure (HH, HL, LH, LL)
Visualizing trend transitions
Spotting breakout levels and swing-based support/resistance
Aiding discretionary swing trading, trend following, or pattern recognition
This indicator keeps the logic simple and visual—ideal for traders who prefer clean chart structure without unnecessary noise.

20 Day Range High/Low (Turtle Soup)This indicator identifies the Highest High and Lowest Low of the last 20 periods (customizable) and projects horizontal support/resistance lines to the right.
Unlike standard Donchian Channels or other High/Low indicators that clutter the chart with historical "steps" or extend lines infinitely to the left, this script focuses on chart cleanliness.
Key Features:
Pivot-Point Start: The lines do not span the whole chart. They start exactly at the candle where the High or Low occurred.
Right Extension: Lines extend only to the future, providing a clear visual for potential breakouts or support levels.
No Historical Clutter: It does not draw the past movement of the High/Low, keeping your chart clean for price action analysis.
Dynamic: As new Highs or Lows are made, the lines instantly update to the new positions.
How to Use:
Trend Identification: Use the High line as a resistance/breakout level (similar to Turtle Trading strategies).
Stop Loss Placement: The Low line of the last 20 days often acts as a trailing stop location for long-term trends.
Timeframes: While designed for the classic "20-Day" lookback on the Daily chart, this script works on any timeframe (e.g., finding the 20-hour range on a 1H chart).
Settings:
Length: Default is 20 bars. You can change this in the settings to any lookback period you prefer (e.g., 50, 100).

GeeksDoByte 15m & 30m ORB + Prev Day High/LowCME_MINI:NQ1!
How It Works
Opening Ranges
At 9:30 ET, the script begins tracking the high & low.
It uses two fixed sessions:
15 min from 09:30 to 09:45
30 min from 09:30 to 10:00
On the very first bar of each session it initializes the range, then continuously updates the high/low on each new intraday bar.
Dashed lines are drawn when the session opens and extended horizontally across subsequent bars.
Previous Day’s Levels
Independently, it fetches yesterday’s high and low via a daily security call.
These historic levels are plotted as simple horizontal lines for daily context.
How to Use
Breakout Entries
A close above the 15 min ORB high can signal an early breakout; a further push above the 30 min ORB high confirms extended momentum.
Conversely, breaks below the respective lows can indicate short setups.
Support & Resistance
Yesterday’s high/low often act as magnet levels. If price is near the previous high when the opening ranges break, you get a confluence zone worth watching.
Trade Management
Combine the two opening-range levels to tier your stops or scale in.
For example, you might place an initial stop below the 15 min low and a wider stop below the 30 min low.

Historical Volatility with HV Average & High/Low Trendlines
### 📊 **Indicator Title**: Historical Volatility with HV Average & High/Low Trendlines
**Version**: Pine Script v5
**Purpose**:
This script visualizes market volatility using **Historical Volatility (HV)** and enhances analysis by:
* Showing a **moving average** of HV to identify volatility trends.
* Marking **high and low trendlines** to highlight extremes in volatility over a selected period.
---
### 🔧 **Inputs**:
1. **HV Length (`length`)**:
Controls how many bars are used to calculate Historical Volatility.
*(Default: 10)*
2. **Average Length (`avgLength`)**:
Number of bars used for calculating the moving average of HV.
*(Default: 20)*
3. **Trendline Lookback Period (`trendLookback`)**:
Number of bars to look back for calculating the highest and lowest values of HV.
*(Default: 100)*
---
### 📈 **Core Calculations**:
1. **Historical Volatility (`hv`)**:
$$
HV = 100 \times \text{stdev}\left(\ln\left(\frac{\text{close}}{\text{close} }\right), \text{length}\right) \times \sqrt{\frac{365}{\text{period}}}
$$
* Measures how much the stock price fluctuates.
* Adjusts annualization factor depending on whether it's intraday or daily.
2. **HV Moving Average (`hvAvg`)**:
A simple moving average (SMA) of HV over the selected `avgLength`.
3. **HV High & Low Trendlines**:
* `hvHigh`: Highest HV value over the last `trendLookback` bars.
* `hvLow`: Lowest HV value over the last `trendLookback` bars.
---
### 🖍️ **Visual Plots**:
* 🔵 **HV**: Blue line showing raw Historical Volatility.
* 🔴 **HV Average**: Red line (thicker) indicating smoothed HV trend.
* 🟢 **HV High**: Green horizontal line marking volatility peaks.
* 🟠 **HV Low**: Orange horizontal line marking volatility lows.
---
### ✅ **Usage**:
* **High HV**: Indicates increased risk or potential breakout conditions.
* **Low HV**: Suggests consolidation or calm markets.
* **Cross of HV above Average**: May signal rising volatility (e.g., before breakout).
* **Touching High/Low Levels**: Helps identify volatility extremes and possible reversal zones.

Volume with High/Low ColoringThe "Volume with High/Low Coloring" indicator is designed to help traders visually differentiate between high, low, and normal volume bars relative to recent historical averages. By applying dynamic color coding and customizable thresholds, this indicator enhances volume analysis and improves your ability to spot key moments of accumulation, distribution, or market inactivity.
High Volume: A bar is marked as high volume when it exceeds the average by a customizable multiplier (default is 1.5×) .
Low Volume: A bar is considered low volume when it falls below the average by another multiplier (default is 0.5×) .
Normal Volume: All bars that fall between the high and low thresholds.
Each category is displayed in a different user-selectable color, providing instant visual feedback for volume dynamics.
Customizable Colors:
High Volume: Light Green (default: semi-transparent green)
Low Volume: Light Blue (default: semi-transparent blue)
Normal Volume: Yellow (default: semi-transparent yellow)
Average Volume Line: Gray (optional reference line)
Swing High Low Detector by RV5📄 Description
The Swing High Low Detector is a visual indicator that automatically detects and displays swing highs and swing lows on the chart. Swings are determined based on configurable strength parameters (number of bars before and after a high/low), allowing users to fine-tune the sensitivity of the swing points.
🔹 Current swing levels are shown as solid (or user-defined) lines that dynamically extend until broken.
🔹 Past swing levels are preserved as dashed/dotted lines once broken, allowing traders to see previous support/resistance zones.
🔹 Customizable line colors, styles, and thickness for both current and past levels.
This indicator is useful for:
Identifying key market structure turning points
Building breakout strategies
Spotting trend reversals and swing zones
⚙️ How to Use
1. Add the indicator to any chart on any timeframe.
2. Adjust the Swing Strength inputs to change how sensitive the detector is:
A higher value will filter out smaller moves.
A lower value will capture more frequent swing points.
3. Customize the line styles for visual preference.
Choose different colors, line styles (solid/dashed/dotted), and thickness for:
Current Swing Highs (SH)
Past Swing Highs
Current Swing Lows (SL)
Past Swing Lows
4. Observe:
As new swing highs/lows are detected, the indicator draws a new current level.
Once price breaks that level, the line is archived as a past level and a new current swing is drawn.
✅ Features
Fully customizable styling for all lines
Real-time updates and automatic level tracking
Supports all chart types and instruments
👨💻 Credits
Script logic and implementation by RV5. This script was developed as a tool to improve price action visualization and trading structure clarity. Not affiliated with any financial institution. Use responsibly.

Trading Session Highs and LowsTrading Session Highs and Lows
This script provides an intuitive way to visualize key market levels from major trading sessions: Asia, London, New York, and New York Close. By automatically plotting the high and low of each session, it helps traders quickly identify important price levels that could impact market behavior.
Features include:
Session Marking: The script marks the high and low for each major session (Asia, London, New York, and New York Close).
Customizable Lines and Labels: You can adjust the line style, width, and color for each session’s high/low markers. The session name (e.g., "London", "New York") and the PDH/PDL (Prior Day High and Low) are also shown to give clear context.
Real-Time Updates: The levels are updated in real-time to reflect the current price action, helping you gauge price movement throughout the trading day.
Customizable Indicators: Easily adjust the visibility of the different sessions and the labels to focus on the session that matters most to your trading strategy.
This tool is designed to help day traders spot important levels for potential breakouts or reversals, making it easier to base your trading decisions on well-established price points. Ideal for scalpers, swing traders, and anyone who trades across multiple sessions.

London ORB + Session High/Low + FVGLondon ORB + Session High/Low + FVG
📘 Script Description: London ORB + Session High/Low + Fair Value Gap
This script is designed to assist intraday traders during the London session open by combining:
🕒 1. Opening Range Breakout (ORB)
Captures the high and low of the first 15-minute candle after the London open (08:00–08:15 GMT).
Draws lines and labels for the ORB High and Low levels.
Detects breakouts above or below the ORB and plots a triangle signal at the breakout bar.
🌐 2. Asian & US Session Levels
Automatically marks the highs and lows of the Asian (00:00–06:00 GMT) and US (13:30–20:00 GMT) sessions.
Useful for identifying prior session liquidity zones, key support/resistance levels, and potential reaction areas.
📉 3. Fair Value Gaps (FVG)
Highlights imbalances in price action between non-overlapping candles (also known as FVGs or inefficiencies).
Draws a shaded box between candles where gaps exist:
Green for bullish FVGs
Red for bearish FVGs
🔔 4. Alert Support
Optional alerts are built in for:
Long breakout (price breaks above ORB)
Short breakout (price breaks below ORB)
🎯 Use Case
Perfect for:
Day traders looking to capitalize on early volatility at the London open
Traders using liquidity-based strategies, retests, or gap-fills
Visualizing and aligning with prior session highs/lows for structure and context

Previous Week & Day High/LowPrevious Week & Day High/Low Indicator
The Previous Week & Day High/Low Indicator is designed to provide traders with key support and resistance levels based on historical price data. It automatically plots the previous day's and previous week's highs and lows as horizontal lines, offering a clear visual reference for potential breakout or reversal zones.
Features:
Clear Visual Levels: Displays previous day's highs and lows in green and red for easy identification.
Weekly Context: Plots previous week's highs and lows using distinct color-coded lines.
Real-Time Updates: Adjusts to new weekly and daily highs and lows as they are confirmed.
Labeled Lines: Each level is labeled directly on the chart, ensuring clarity without clutter.

Previous HTF Highs, Lows & Equilibriums [dani]Previous HTF Highs, Lows & Equilibriums
Indicator Description
This powerful and user-friendly indicator is designed to help traders visualize key levels from multiple higher timeframes directly on their chart. It plots the previous session's high, low, and equilibrium (EQ) levels for up to 4 customizable timeframes, allowing you to analyze price action across different time horizons simultaneously.
Key Features
Multi-Timeframe Support:
Choose up to 4 higher timeframes (e.g., 1H, 4H, 1D, 1W) to plot levels on your chart.
Each timeframe's levels are displayed with clear, customizable lines.
Previous Session Levels:
Plots the previous session's high, low, and EQ (EQ = (high + low) / 2) for each selected timeframe.
Levels are dynamically updated at the start of each new session.
Customizable Line Styles:
Choose between solid, dashed, or dotted lines for each level.
Customize colors for high, low, and EQ levels to suit your preferences.
Dynamic Labels:
Each level is labeled with the corresponding timeframe (e.g., "1D - H" for daily high, "4H - L" for 4-hour low).
Labels are positioned dynamically to avoid clutter and ensure readability.
Toggle On/Off:
Easily toggle the visibility of all levels with a single button, making it simple to declutter your chart when needed.
Compatible with All Markets:
Works seamlessly across all instruments (stocks, forex, crypto, futures, etc.) and timeframes.
How to Use?
Add the indicator to your chart.
Select up to 4 higher timeframes to plot levels.
Customize line styles and colors to match your trading style.
Use the levels as reference points for support/resistance, breakout zones, or confluence areas.
Toggle levels on/off as needed to keep your chart clean and focused.
Disclaimer & Chat
This indicator is not a trading signal generator. It does not predict market direction or provide buy/sell signals. Instead, it is a tool to help you visualize key levels from higher timeframes, enabling you to make more informed trading decisions. Always combine this tool with your own analysis, risk management, and trading strategy.
Thank you for choosing this indicator! I hope it becomes a valuable part of your trading toolkit. Remember, trading is a journey, and having the right tools can make all the difference. Whether you're a seasoned trader or just starting out, this indicator is designed to help you stay organized and focused on what matters most—price action. Happy trading, and may your charts be ever in your favor! 😊
From, Dani.

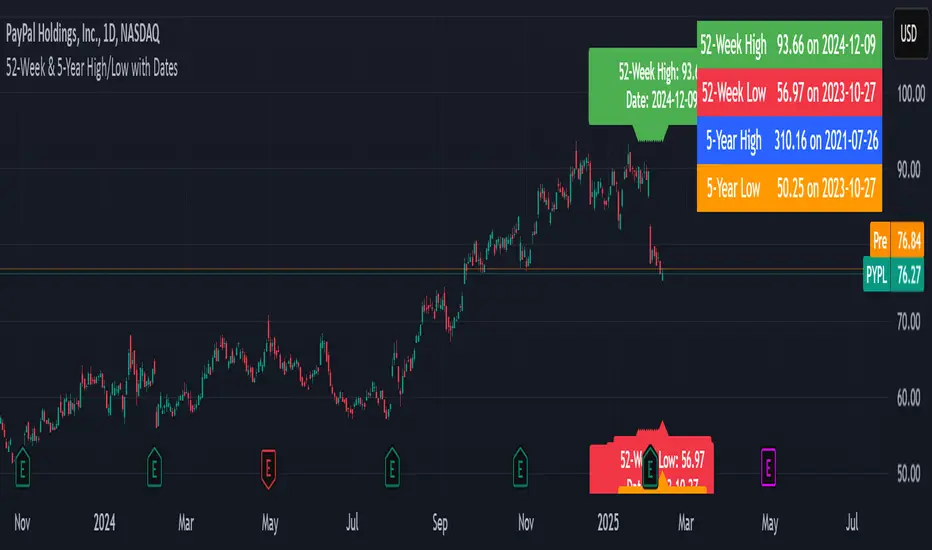
52-Week & 5-Year High/Low with DatesThis indicator is designed to help traders quickly identify key price levels and their historical context by displaying the 52-week high/low and 5-year high/low prices along with their respective dates. It provides a clear visual representation of these levels directly on the chart and in a dashboard table for easy reference.
Key Features
52-Week High/Low:
Displays the highest and lowest prices over the last 252 trading days (approximately 52 weeks).
Includes the exact date when these levels were reached.
5-Year High/Low:
Displays the highest and lowest prices over the last 1260 trading days (approximately 5 years).
Includes the exact date when these levels were reached.
Visual Labels:
High and low levels are marked on the chart with labels that include the price and date.
Dashboard Table:
A table in the top-right corner of the chart summarizes the 52-week and 5-year high/low prices and their dates for quick reference.
Customizable Date Format:
Dates are displayed in the YYYY-MM-DD format for clarity and consistency.
Session High/Low Average & Range [1CG]The Session High/Low Average & Range indicator independently measures the average price movement from the opening price in each direction. It also displays the maximum high and low distance, called Range. Separating the averages and range into highs and lows helps analyze the volatility of the market as well as the direction.
USE EXAMPLES
Session Open
Session Close
Customization
Minimal - 1x and 2x Averages are replaced with custom lines, in order to show distance to3x.
Calculations
Average High: (high price of session - session opening price) / (session period)
Average Low: (session opening price - low price of session) / (session period)
Range High: The highest price of the last (session period)
Range Low: The lowest price of the last (session period)
INPUTS
Session
Here you can choose the hours for your session and time zone. The default is London session in New York time. Next, the session period determines how many sessions to sample from for the average and range lines, the default is 20. Lastly, you can choose the number of sessions to appear on the chart not including the current session if you are in one, 5 by default.
Lines
All of the lines allow you to change the color, width, and style. They also have a label option to choose to display the price. The bottom of the section allows you to change the location and size of the label text.
**Open Line** -Displays the opening price for the length of the session.
**Average Lines** - Displays the 1x, 2x, and 3x the average distance from open in each direction. Additionally, you can toggle a background color to highlight the area.
**Custom Lines** - Displays a customizable multiple of either the average or range. By default the first custom line displays the Range at a 1x multiplier and the second line displays an Average at a 1.5x multiplier
Display Distance
Here you can choose to display the distance from the lines to the open. This data is marked with a “Δ”. For the three Average lines this will display in the area between the line and the open in the position and size of your choice. The custom lines will have the distance information displayed on the line itself. This helps keep the data organized.

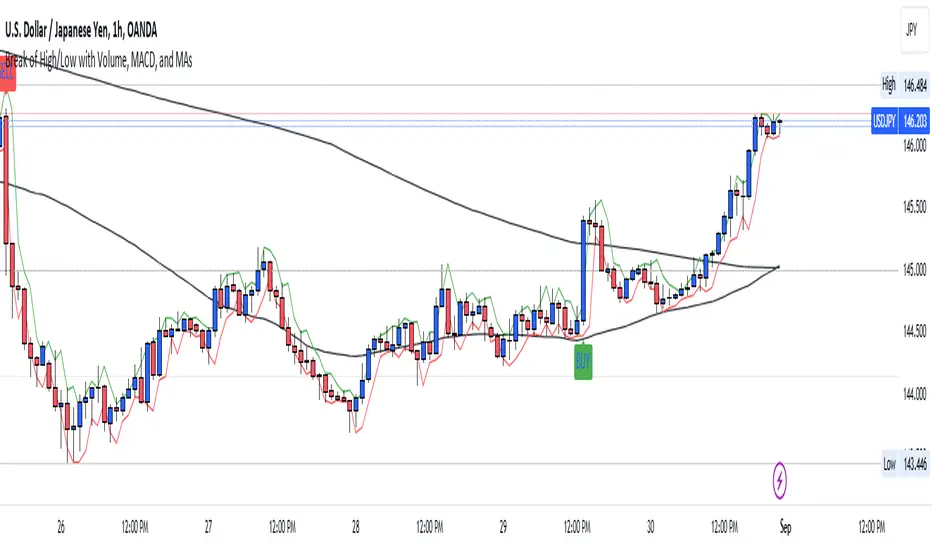
Break of High/Low with Volume, MACD, and MAsHow It Works:
Sessions:
The London session is defined between 8:00 and 16:00 UTC.
The New York session is defined between 13:00 and 21:00 UTC.
Previous High/Low:
The script identifies the highest high and lowest low from the previous bar using ta.highest(high, 1) and ta.lowest(low, 1) .
Candle Body Size:
The script calculates the size of the current candle's body and checks if it is at least double the size of the previous candle's body.
Volume Check:
A high volume threshold is set as 1.5 times the 50-period SMA of the volume.
MACD Crossover:
The script calculates the MACD and its signal line and checks for bullish (buy) or bearish (sell) crossovers.
Signals:
A long signal (buy) is generated if the price breaks the previous high with a large body candle, high volume, and a bullish MACD crossover during the specified sessions.
A short signal (sell) is generated if the price breaks the previous low with a large body candle, high volume, and a bearish MACD crossover during the specified sessions.
Plotting:
The 50-period and 200-period moving averages, previous high, and previous low are plotted on the chart.
If a long condition is met, a "BUY" label is displayed below the bar. If a short condition is met, a "SELL" label is displayed above the bar.
Alerts:
Alerts are triggered whenever the conditions for a long or short trade are met.
Customization:
Feel free to adjust the session times, volume threshold, MACD settings, or moving averages based on your trading strategy or the specific asset you are trading.
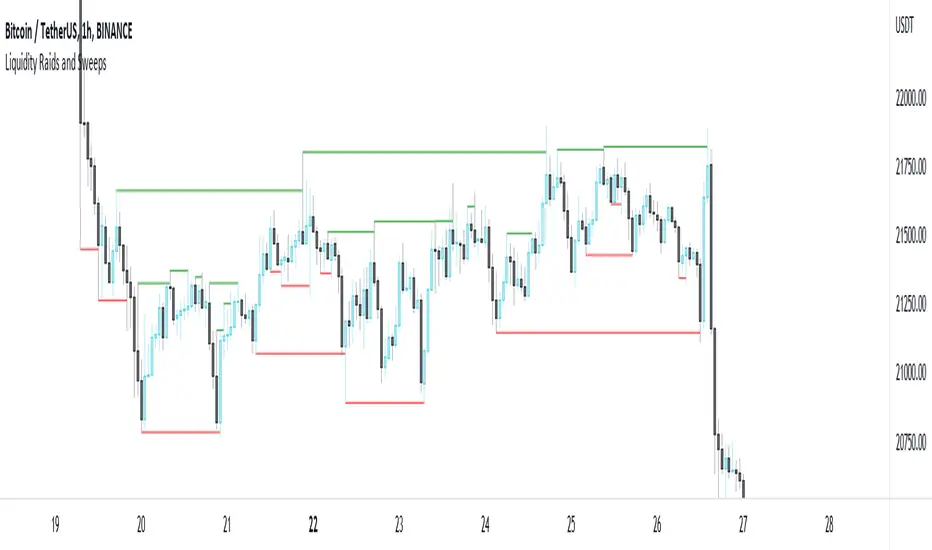
Liquidity Raids and Sweeps by TexmoonbeamLiquidity is a vital concept in trading. It gives us an indication of where buy / sell orders are in the market, and the direction price is likely to move once this liquidity has been taken.
The purpose of this indicator is to show you when and where there has been a 'raid' or 'sweep' of this liquidity, meaning a reversal might occur.
The indicator does this by looking for candle wicks, that go beyond a previous pivot high or low.
Settings:
Timeframe – This settings changes the timeframe that the indicator looks for raids/sweeps. Higher timeframes generally mean stronger moves.
Left bars – the number of bars gap higher/lower to the left of a pivot low/high. A higher number means the high or low was formed from a stronger move.
Right bars – the number of bars gap higher/lower to the right of a pivot low/high. A higher number means the high or low started a stronger move.
Max Gap – the maximum number of candles between a raid or sweep. Reduce this number on higher time frames if there are memory errors.
Min Gap – the minimum number of candles between a raid or sweep.
Alerts Wait For Close – If ticked, this means an alert will not be triggered by the current candle wick, overlapping a previous, until the close of that candle. Unticked you will be alerted as soon as the current candle crosses a previous high/low, though it might close far beyond that point and not actually turn out to be a raid/sweep.
Buy Side/Sell Side – line style and colour preferences for buy and sell side.
Strategy:
As seen in the example chart, the raid/sweep of liquidity, where only a wick reaches beyond a previous high or low, can be followed by a reversal of direction, often to seek other liquidity targets. This indicator could provide an opportunity to enter a trade at this point and the alert feature means you will be able to set up custom alerts on multiple charts or timeframes.
You should use other confluence and a lower time frame confirmation after a raid/sweep, to identify your entry, stop loss and targets. Familiarity with liquidity and smart money concepts are recommended.
Session High Low
This indicator shows Session High Low line and prices.
1: Session range is adjustable based on your timeframe. Nomore confusing timezone settings.
You can choose your timezone then set your Session start and end time.
Script will show you the following session high and low lines which is extendable until next session.
2: All historical lines and price levels are can be partially or fully hidden.
And line colors are adjustable so you can use suitable color on your chart.
Based on session you choose this script can be used as a session break strategy AKA (Asian session break, London session break strategy).
You can create your own trading Session and high lows.
Personally I monitor how price reacts on London session high lows during the NewYork trading session.
In this chart Session starts at 8am (London open) and closes at 12:30 (NewYork open). Script is showing high lows only in this session range.
Always double confirm with your trading style. It's not a Financial advice.
Inputs:
1: Hide history - Hides all historical lines and prices that means you can see only todays session.
2: Show price - Shows price level of session high lows. You can hide price level if you want to see only lines.
3: Session time - You can set your time range of session.
4: Start time - Session start time. You can see vertical line on your chart or you can hide line.
5: End time - Session end time. You can see vertical line on your chart or you can hide line.
6: Line extend time - End of the high low lines. You can draw line until the end of the session or you can draw short line.
7: All line and price colors are optional.
Thank you.

Realtime All-Time High and All-Time Low Tracker [WIP]This is a study intended to port the work of /u/QuantNomad's "Kozlod - All-time high/low alerts" to pine version 4 without giving any alerts. It is intended to capture the most extreme points on any given price chart in real time, the absolute high and absolute low points. Ideally, the plotted lines would strictly diverge from one another in opposite directions and widen with new highs or lows on a hypothetical "all-time" resolution.
Most of the original code was replaced and I'm trying to resolve a bug where the script fails to register new highs or lows while at the same time making sure that earlier data is plotted correctly. If applied to an asset that has not yet recovered , is just too new, or has not achieved a lower low than its opening price, this indicator ceases to function correctly. This would not be an issue if pine script was more general purpose and had something similar to Python's max(list) function.
Any and all suggestions are welcome. This is simply to serve as a springboard for any programmers trying to design algorithms or strategies that use these variables on any price chart.
Happy Hunting!
- Patch Hemlock

Donchian Channel - Pivot High-LowCombining Pivot High Low and Donchian Channel - both of which are useful indicators for trend following.
Donchian Channel shows highest and lowest prices for X number of bars.
Pivot High-Low identifies when price made new Highs and Lows
Applying Donchian Channel on Pivot High-Low channel, we are plotting highest and lowest pivots formed in X bars.
In this indicator, we have 3 options for Channel Base :
Price : This is regular Donchian channel based on High-Low Price
Pivots : This is Donchian channel based on pivot points.
Combined : Combines both. Takes highest of Price and Pivots for plotting high, lowest of Price and Pivots for plotting low

Previous Day High Low [NLB]Hello Everyone Its Previous Day High Low Indicator but advance and many of features.
How to work its indicator?
➤ Its Previous day high low indicator if Previous day high break when Long signal if Previous day Low break when Short signal & you can also add buffer with Previous day high or Low
Indicator Feature
➤ Long Signal with Alert
➤ Short Long Signal with Alert
➤ Take Profit with Alerts calculate by Previous day high or low by default 1 percent you can also change values
➤ Trailing Stop Loss with Alerts
➤ Previous Day High or Low Buffer
➤ Take Profit, Buffer, Trailing Stop Loss Value You can also choose Percentage or Point by default percent
Important: This Indicator we are using for Automation Trading if You Want This Indicator Access Please Contact me PM on Tradingview
